
If you find that your presales organization is struggling to keep up with demand, here’s an exercise you can use to analyze your shortfall and create a foundation for scaling presales to meet that demand.
Defining the Gap
To scale effectively we need to start by defining the gap we need to address and where scaling strategies need to be applied.
There are two types of gaps:
- Increasing Demand Gap
- Key Activity Gap
Definition of the “Increasing Demand” Gap
This gap simply means that for whatever reason, you have an increasing demand for presales resources coming from the sales team. It could be that marketing is spending more and generating more leads. It could be that Sales is hiring and you don’t have the correlating budget increase to hire in presales. It could be that you’re going down-market where volume is higher. Or perhaps qualification on demos is getting worse and worse and you are spending more time on “wasted” demos. Somehow the demand is growing.
There are two key questions:
- What’s the gap in our capacity to handle the demand and the demand that’s coming in?
- What is causing this gap?
Definition of the “Key Activity” Gap
Key Activity gap analysis means taking a deeper look at the activities your SEs are currently doing and compare them with the activities they need to be doing to meet the increased demand gap. For example, if SEs are doing too many repetitive standard demos and are compromising their time on discovery, strategic consulting or other key activities, then perhaps we can find a way to take so many repetitive standard demos off their plates.
Let’s take a look at how to conduct each type of gap analysis.
Conducting an “Increasing Demand” Gap Analysis
There are many different ways to conduct a demand gap analysis. Here, we’ll examine a simple demand gap analysis using the AE:SE ratio.
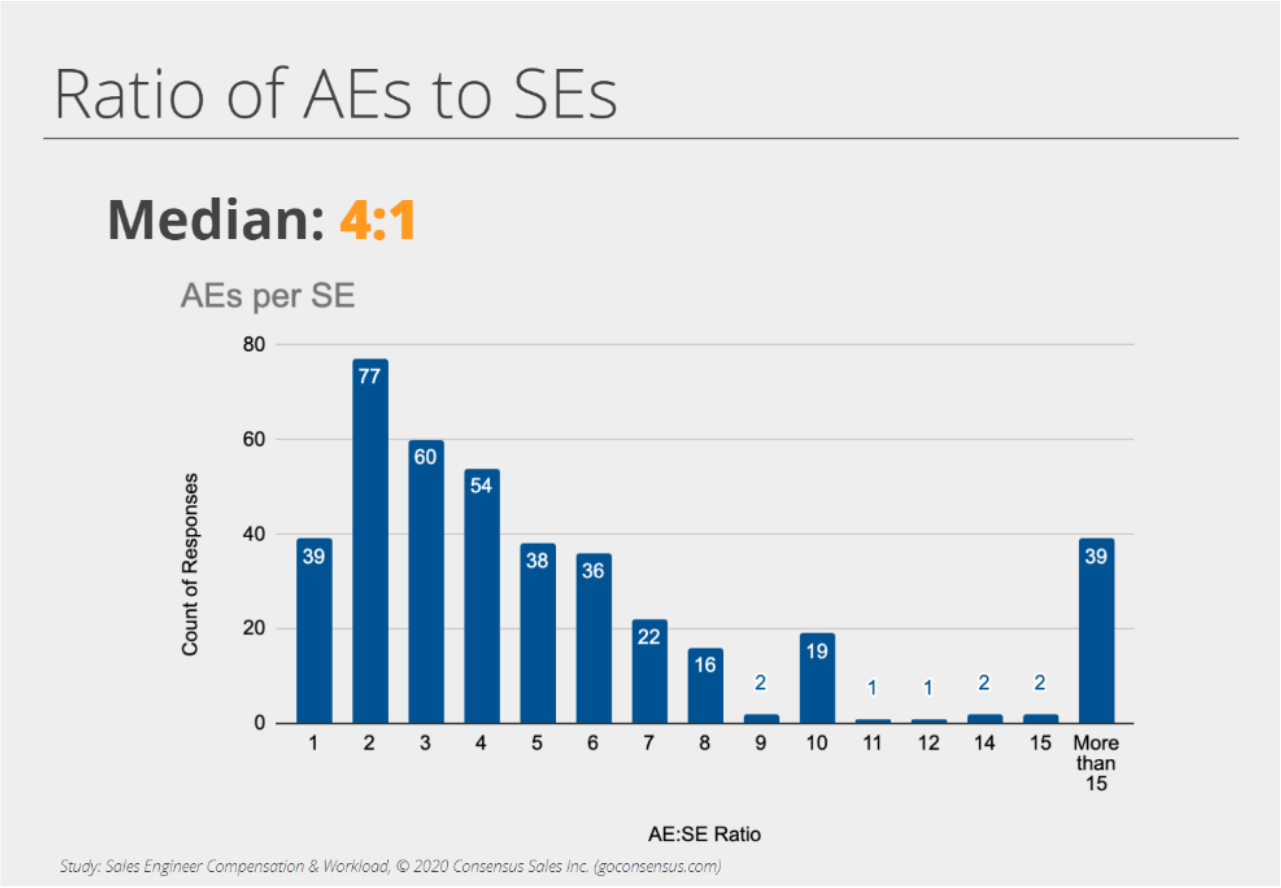
Research in the Consensus Sales Engineer Salary and Workload Report shows the median AE:SE ratio is 4:1.
Let’s start with a scenario. Suppose that today we have 40 SEs and we have an AE:SE ratio of 4:1. Now suppose that the future sales team is going to be 230 people. That future state of 230 salespeople divided by four (i.e. the AE: SE ratio) means we need 58 sales engineers to meet the future demand. That’s if we don’t change anything—if we keep doing things the same way and don’t find a way to scale.
So that’s the first step in this simple gap analysis approach. Of course, if we subtract the number of sales engineers we have today, this means we need to hire 18 new SEs. The problem is, this really isn’t scaling— this is just linear hiring. When we talk about scaling, we’re not talking about hiring, even though hiring is always an important part of any plan. The problem is that oftentimes sales will hire without presales getting a compensatory budget to hire on the same correlated path.
So what if you can’t hire enough to keep up? What if that’s just not in the cards? That’s the scenario here. There are lots of other reasons that could cause a demand gap, but in this scenario we’ll assume it is an increase in sales hiring.
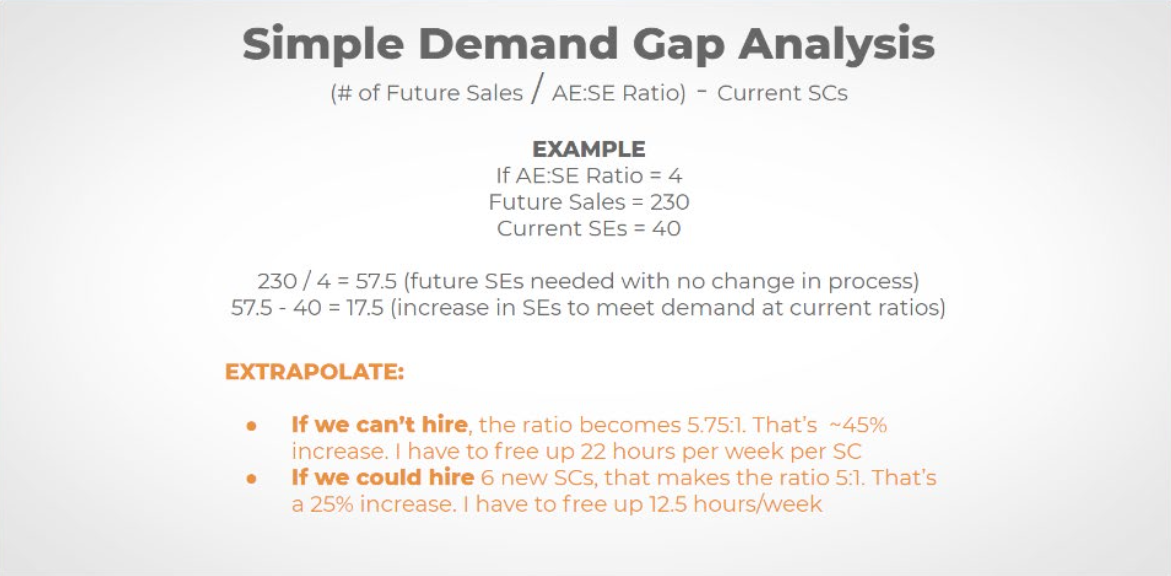
Let’s extrapolate a little bit. If we can’t hire at all, the ratio ends up becoming 5.75:1, that’s a 45% increase and that means we have to free up 22 hours per week, per SE. However, sometimes you get some budget to hire, just not enough to keep up linearly with the sales hiring.
So suppose that we could hire six new solution consultants instead of the eighteen that we need. That would end up making the ratio 5:1. That’s a 25% increase in demand even if we get the six new hires. So we have to somehow either ask everybody to work an extra twelve and a half hours a week (a good recipe for losing some of your team) or we have to try to free up 12 and a half hours a week through scaling strategies.
Scenario Summary
Our “Increasing Demand” gap is 12.5 hours per week per SE (or 25% on a 50 hour workweek). Now multiply this by your total team headcount to find the demand gap for the entire team. If you have a team of 25 SEs, you’ve just identified that your demand gap is 312 hours per week or 16,250 hours per year.
Conducting a “Key Activity” Gap Analysis
In this scenario, let’s suppose that we know that we have an increasing demand gap of 12.5 hours per week per SE. We now need to conduct a Key Activity gap analysis to identify activities which are candidates for our scaling strategy focus.
Q: Do you know which activities your SEs are spending time on?
It’s pretty common not to fully understand how sales engineers spend their time. But at the risk of encouraging micromanagement, if you don’t know how they’re spending their time, how can you know how to adjust your processes or KPIs?
Short of tracking every activity that they do (which is actually becoming possible with some of the tools that are coming online these days), I recommend talking to different team members and perhaps surveying your team and asking them how many hours per week they spend on activities X, Y, or Z, or how many hours per month. We’re going to look at it from a weekly perspective. (Note: This analysis could be more beneficial if tracked by month, depending upon your organization.)
Potential activities to list on your survey could include:
- Discovery
- Technical Demos
- POCs
- Consulting Calls
- Repetitive “Micro Demos”
- Repetitive Standard “Qualifying Demos”
- Repetitive FAQ and Closing Demos
- Customer Support
- Improving Product Knowledge
- Planning and Architecting Solutions
- RFPs
- Training and Mentoring
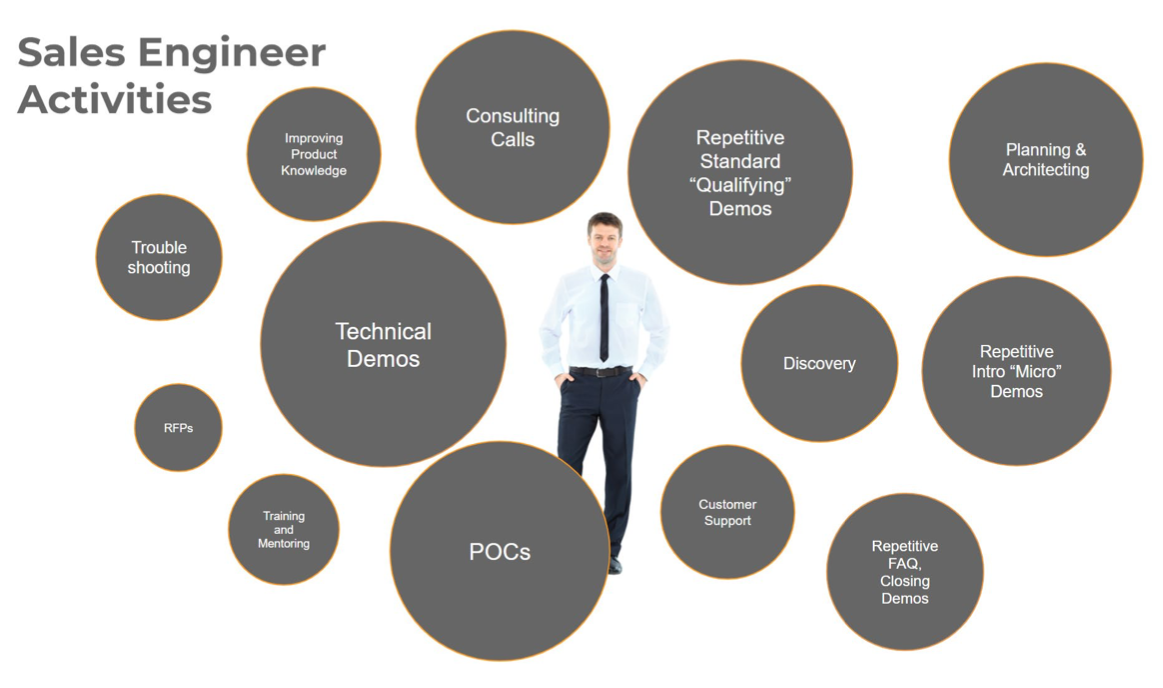
When you look at all of the different things that they get pulled into it’s easy to see why SEs can get over overloaded. It’s also easy to see why SEs are arguably the most valuable resources in your entire go-to-market strategy.
The question that we should ask is “What’s the best use of the SE’s time?” What are the key activities that would change the game if they could spend more time on those?
Again, the answer will be unique to your organization. But let’s just suppose that these are the key things that we want them to spend as much time as possible on: technical demos, POCs, consulting calls, discovery, planning and architecting, and improving product knowledge.
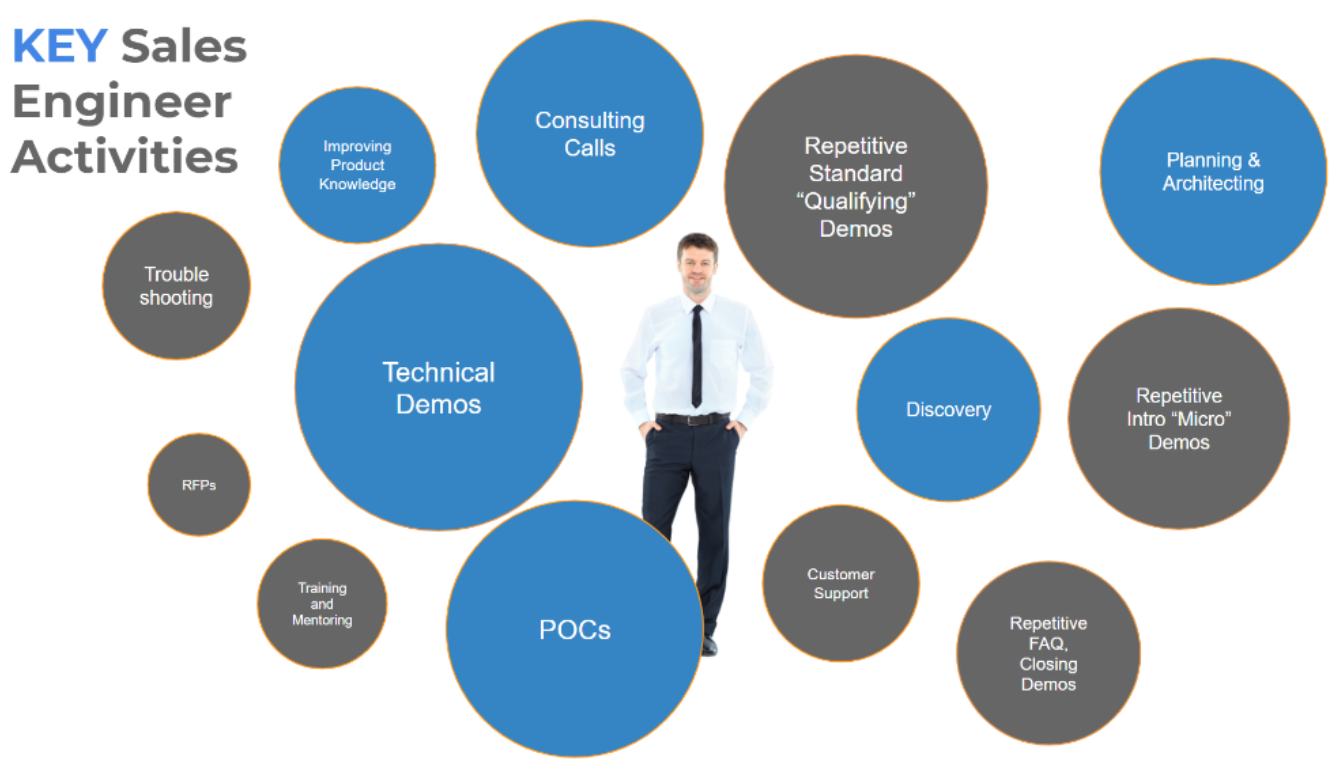
If we could get them to spend 80% of their time on these key activities, then we would say that each sales engineer is really being most effective. If they’re spending too much time on other things, they’re not doing what they’re uniquely skilled to do.
Are there some of these other activities that we can offload so that we can increase the amount of time they spend on these key activities?
Remember that strategy is about tradeoffs.
What would you say No to so that you can increase the time your SEs spend on the best activities?
Obviously, we can’t just say “No, we’re not going to do that.” Instead of saying No entirely, we can ask, “What other way can this be handled?”
The Theory of Constraints
The Theory of Constraints is a methodology for identifying the most important limiting factor that stands in the way of achieving a goal and then systematically improving that constraint until it’s no longer the limiting factor. The limiting factor is often referred to as a bottleneck.
What is the bottleneck in presales?
It may vary from company to company. Maybe the biggest bottleneck is proof of concepts and getting those set up and managed. Maybe it is discovery. As reported by many of the companies we talk to, we’ll examine the bottleneck of doing repetitive and often unqualified demos.
Spreadsheet Sample for Calculating Activity Gap Analysis
Once you know what your SEs are spending their time on, you’re ready to look for opportunities. Let’s take a look at how using a spreadsheet can help.
Download the Key Activities Gap Analysis Spreadsheet Example ⬇️
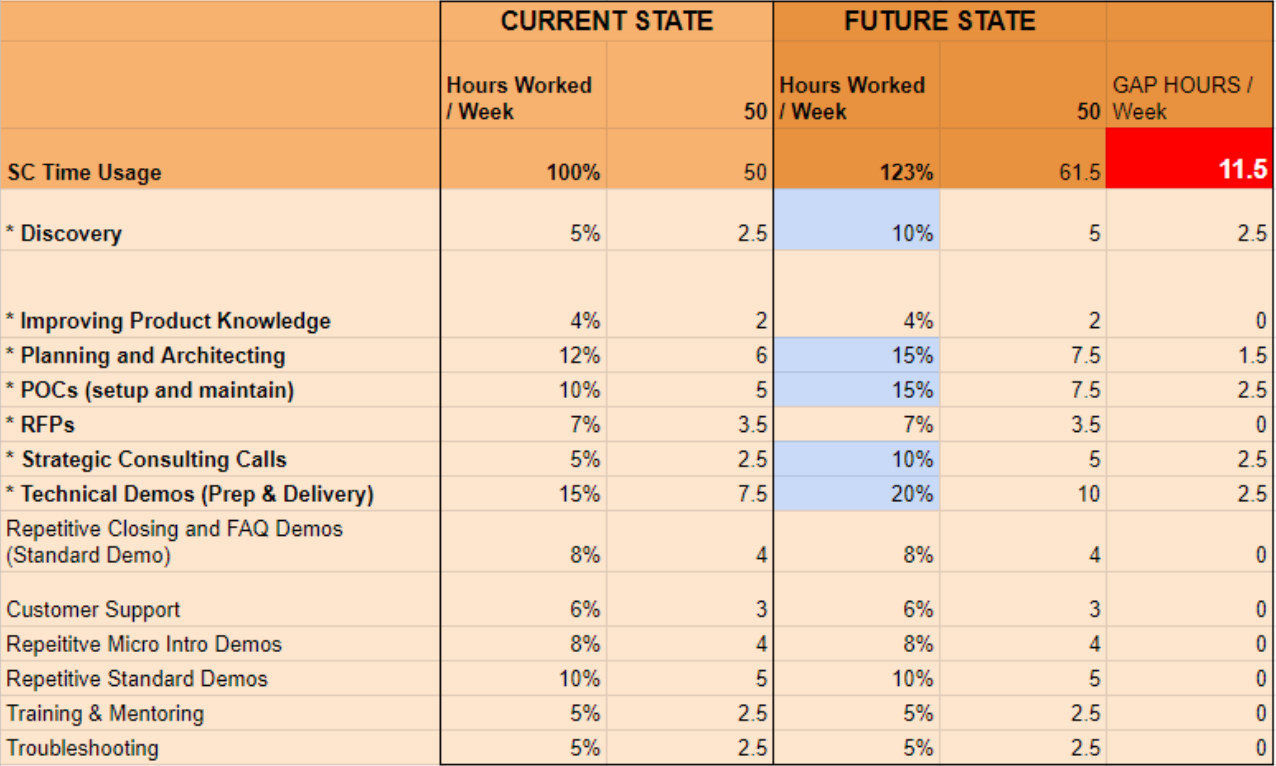
Look at the first two columns in the spreadsheet shown above. What we’re doing here is listing out the different activities and the percentage of time spent on each activity. I’m assuming a 50 hour work week in this example. The activities with asterisks are the ones that we want them to spend more time on. If we can somehow offload some of these other things and have them spend more time in here, then we can increase our output on these key activities and handle increased demand.
The table cell in blue shows the desired increase. You can see that we would need to save 11.5 hours of time per week (red cell) to increase the time spent on key activities.
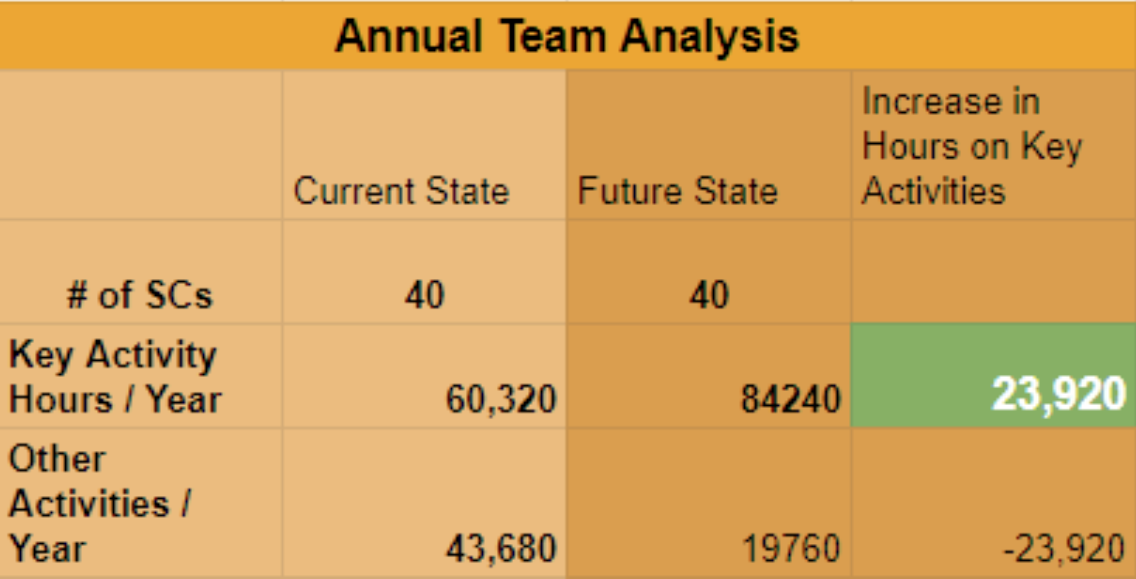
Here’s a summary of the same table:
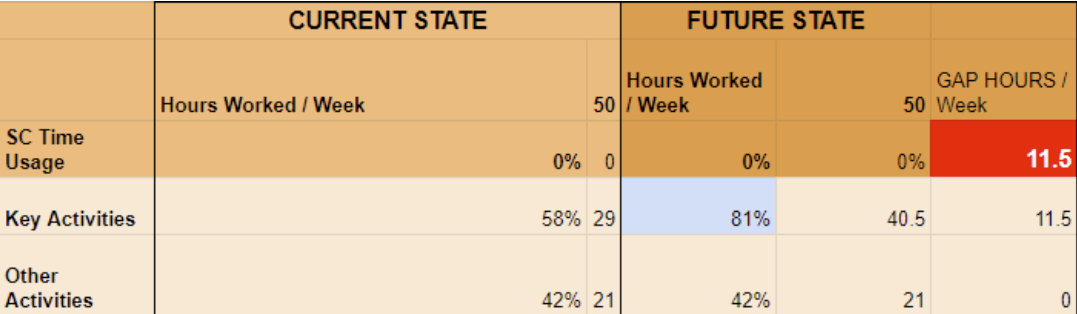
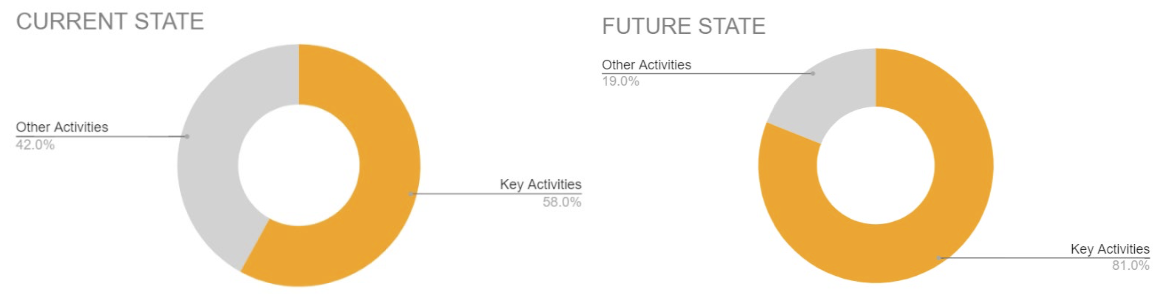
Another broad way to look at this is that they are spending 58% of their time on key activities today and we want to increase their key activities to 81% of their time.
To increase their time on key activities to 81%, we need to decrease the amount of time they spend on non- key activities. In this example, we’ll decrease their time spent on repetitive demos and customer support:
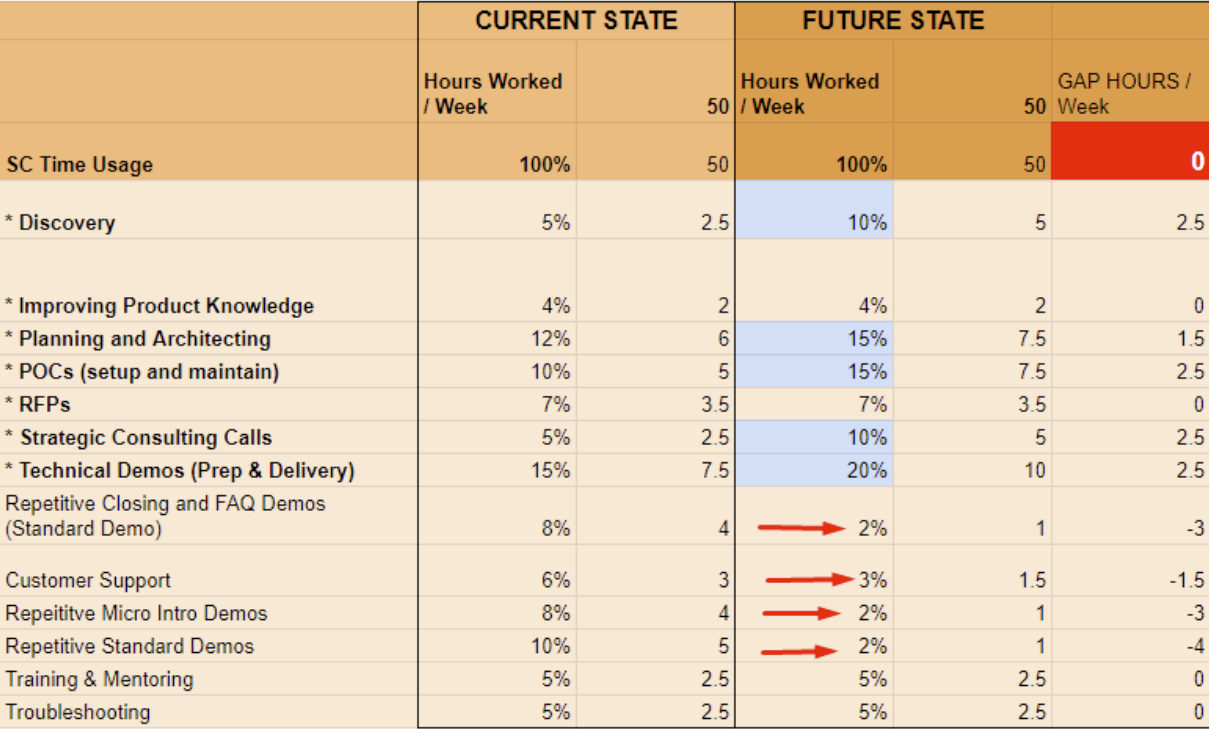
By increasing key activities and decreasing time spent on repetitive demos, we save 11.5 hours per week per SE. Across an entire team of 40 SEs, that is 23,920 hours per year.
This begs the question: how can we get them to spend so much less time on repetitive demos so we can gain the increase in key activities?
By applying the principles of “Eliminate, Automate, Delegate.“
To learn the strategies that enable presales to repurpose SE time, download our free ebook:
Scaling Presales: 8 Strategies to Boost Coverage and Customer Experience With Existing Headcount