
*FREE* WORKSHEET INCLUDED*
Demand for Presales goes up because buyers expect more from them across the customer lifecycle (for things like demos, discovery, solution architecting). But the requests come from Sales, Marketing, BD, CS, etc.
It usually creates a bottleneck. For example, when the Sales team is growing and hiring, 2 things happen: Presales doesn’t get a correlated budget to grow in pace with Sales, and even if they do it takes SEs 2-3X longer to onboard. Either way, they can’t keep up.
Which is why Scaling Presales has become such a hot topic. Leaders recognize that they need to get exponential results from the resources they have.
Any effort to scale Presales should start with 1) defining your demand gap and 2) defining your activities gap. In other words, you need to understand if you have the capacity to support incoming demand for Presales, and determine whether it’s the right kind of demand.
- Gap 1: Increasing Demand Gap
The number of hours that are going to be required in the future because of increasing demand without linear budget increases.
- Gap 2: Key Activity Gap
What SEs are spending time on vs. what they should be spending time on.
Definition of Increasing Demand Gap
Somehow, demand is growing. Gaps emerge when you can’t keep up. I mentioned the scenario of when the Sales team is growing, but the same basic thing happens when you move down market – high touch doesn’t work because the margins break, so you have to figure out how to do more with less.
When these gaps do emerge, answer these two questions:
- What’s causing the gap?
- What’s the gap in your capacity to handle the incoming demand?
Definition of Key Activity Gap
It requires taking a deeper look at current activities, along with the customers they’re spending time with and the internal teams (like Sales, CS, Marketing) who are driving the demand for their time.
For example, if your SEs spend a lot of time on lower impact tasks – like repetitive standard demos – at the expense of good discovery, strategic consulting or custom technical demos, find ways to eliminate, automate or delegate those distractions.
Remember this axiom: Not more, at first, but better. Then if you can do more, it’s more of the right things.
Each gap requires analysis. Here’s how do both:
Conducting an Increasing Demand Gap Analysis
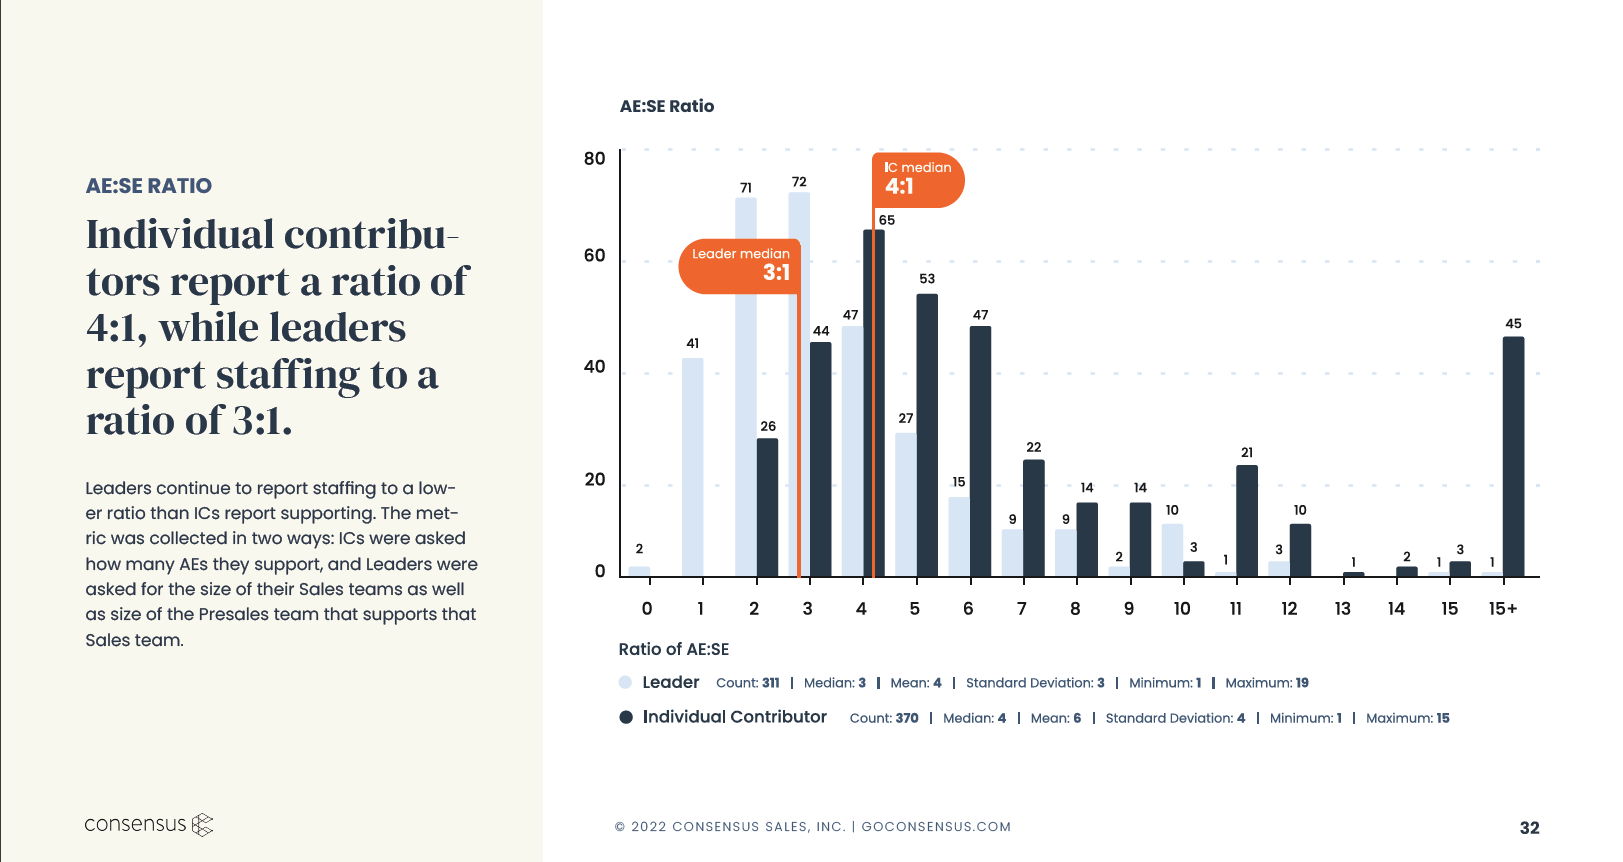
There are lots of ways to conduct a demand gap analysis. One of the simplest is to begin by calculating your AE:SE ratio. Research from our 2022 SE Workload and Comp Report shows the median AE:SE ratio according to leaders is 3.6:1 and according to individual contributors it’s 6:1. It averages across all respondents to 4:1.
If you have 40 Sales Engineers with an AE:SE ratio of 4:1 and the Sales team grows to 230 Account Executives, you need 58 SEs to maintain that ratio, or 18 new SEs. Maintaining a ratio isn’t scaling – it’s just linear hiring. But even if that’s how you wanted to solve this gap, Sales often grows through hiring without allocating a compensatory budget for Presales to hire on the same correlated path.

If you can’t keep up with any new hires, the new ratio shows a 45% delta, which means you have to free up 22 hours per week per SE.
If you allocated enough budget for 6 new SEs (assuming no attrition), instead of needing 18 new reps, it’s only 12, but that’s still a 25% increase in demand.
Either you ask everybody to work an extra 12.5 per week, and burn them out, or you figure out how to free up 12.5 hours a week by scaling.
If 12.5 hours per week per SE is your Demand Gap (on a 50 hour workweek), multiply this by your total headcount to find the Demand Gap for the entire team. If you have 25 SEs, your demand gap is 312 hours per week or 1,250 hours per year.
Conducting a Key Activity Gap Analysis
Download the free Activity Gap Analysis Worksheet here
Once you establish your Increasing Demand Gap (in the above scenario it’s 12.5 hours per week per SE), you can now run a Key Activity Gap analysis to see what activities are candidates for your focus on scaling strategies.
Do You Know What Activities Your SEs Are Spending Time On?
It’s pretty common to not fully capture how Sales Engineers spend their time. Not to encourage micromanagement, but if you don’t know how they’re spending their time, how can you know how to adjust your processes or KPIs?
Short of tracking every activity, start by surveying your team to uncover how many hours per week they think they spend on activities X, Y, or Z.
To get you started, here’s a list of possible activities to include in your survey:
- Discovery
- Technical Demos
- POCs
- Consulting Calls
- Repetitive “Micro Demos”
- Repetitive Standard “Qualifying Demos”
- Repetitive FAQ and Closing Demos
- Customer Support
- Improving Product Knowledge
- Planning and Architecting Solutions
- RFPs
- Training and Mentoring
- Customer Support
You can also refer to our SE Report to see what 1000+ survey respondents reported on how they spend their time vs. what they determine are the highest value engagements.
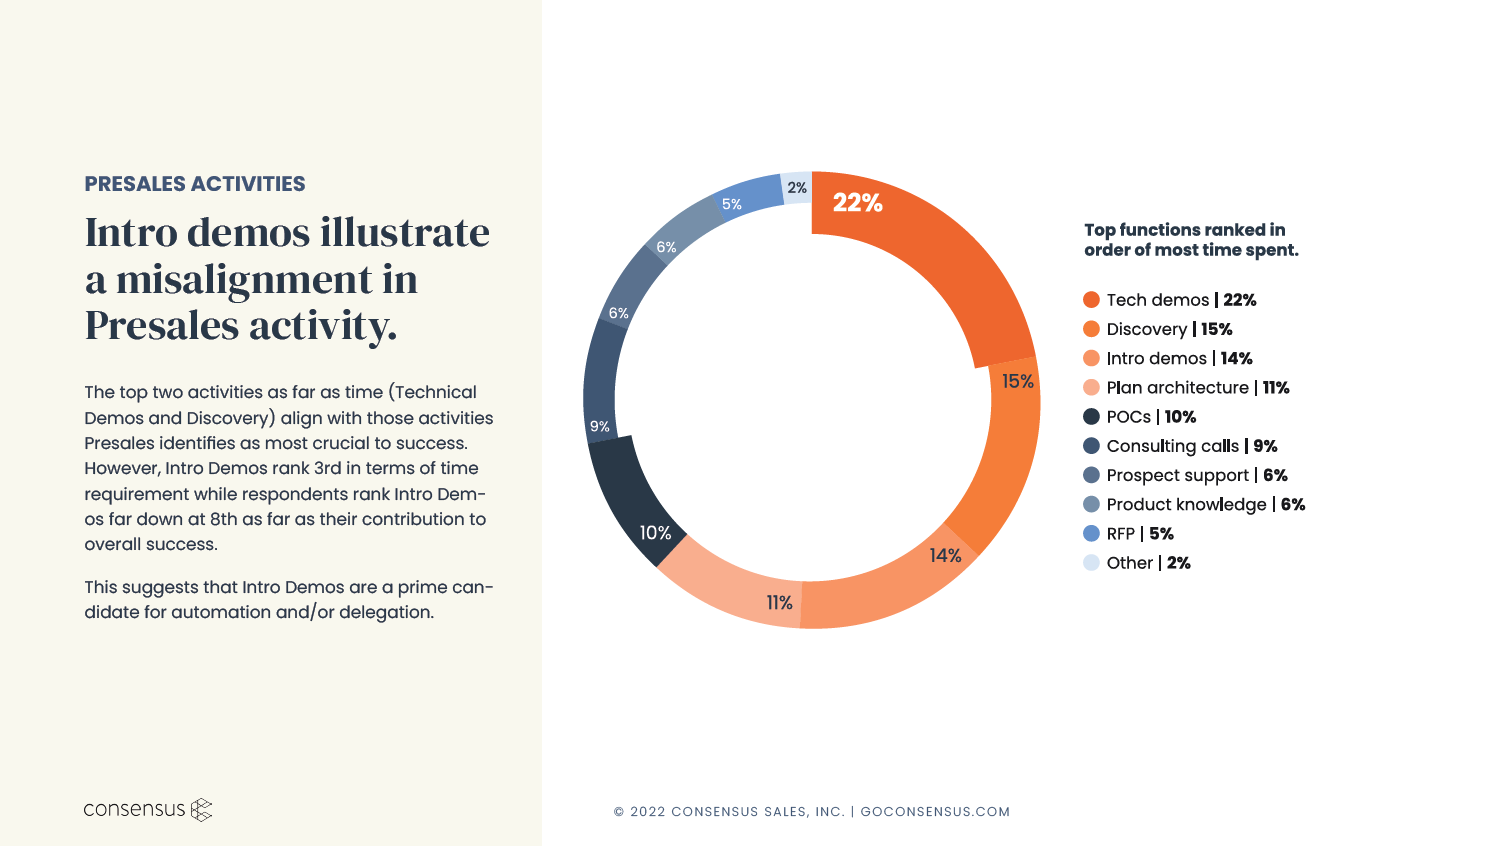
When you evaluate at the individual level where SEs spend time (and across the teams they support, including CS, Marketing and BD), it’s easy to see why SEs get overloaded. It’s also apparent that your SEs are arguably your GTM strategy’s most valuable resources.
So what is the best use of the SE’s time? What are the activities that have the biggest material impact on outcomes?
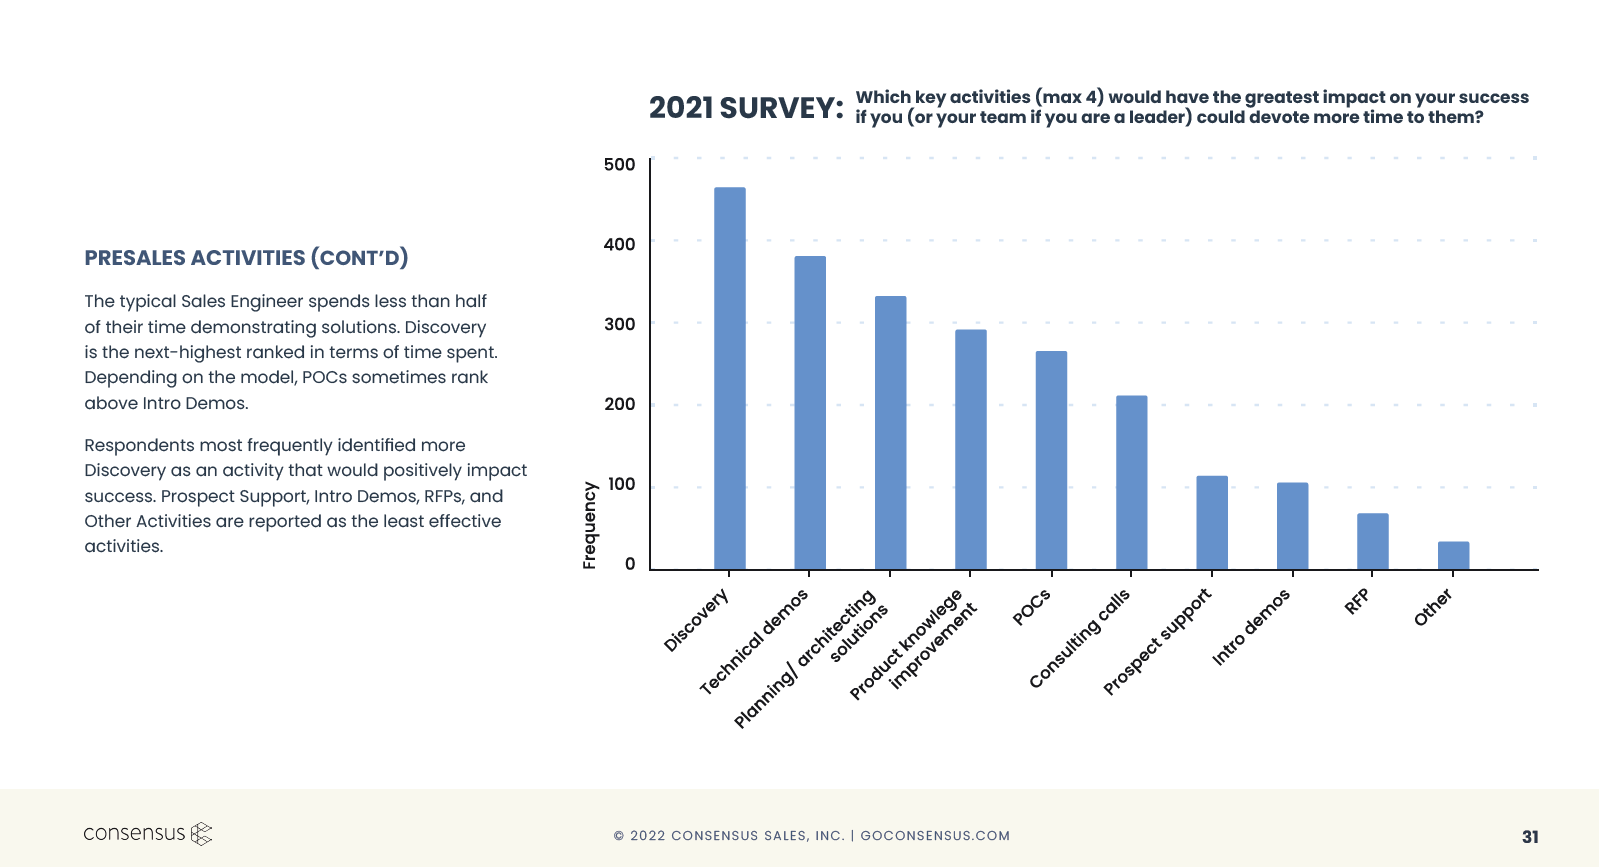
The answer might have some uniqueness in your organization, but assume these are directionally aligned to what respondents said. If so, you’d want them spending as much time as possible on:
- Technical demos
- POCs
- Consulting calls
- Discovery
- Planning and architecting
- Improving product knowledge
Once you know the split between actual and ideal, set achievable improvement goals. If you could, for example, refocus 80% of SE time to the high impact activities above, how much would that change outcomes at your organization?
The reality is most SEs are dragged into things that do not lean into what they’re uniquely trained and skilled at doing. What can you help them offload and what can you reasonably help them ramp up?
Remember the strategic principle of tradeoffs: What would you say NO to so that you can increase the time your SEs spend on the best activities?
Just saying, “No, we’re not going to do that,” is not an option. The right question is, “What other way can we handle this?”
The Theory of Constraints
The Theory of Constraints is a methodology for identifying the most important limiting factor that stands in the way of achieving a goal and then systematically improving that constraint until it’s no longer the limiting factor. The limiting factor is often referred to as a bottleneck.
What is the bottleneck in presales?
The biggest bottleneck may be the POC (proofs of concept) – getting them properly set up and managed. It may be the discovery phase. We’ve already established that one of the chief Presales bottlenecks is the time required to deliver repetitive and unqualified demos.
Spreadsheet Sample for Calculating Activity Gap Analysis You’re now ready to look for opportunities to scale. Again you can download the Activity Gap Analysis spreadsheet here for help.